
How SmartScrews help scale up your wind turbine
21. May 2021
3 ways our SmartScrews help with lifetime extension of your wind turbines
18. June 2021The bathtub curve is a classical model in the prediction of failure events of a product. This curve is useful to conceptualize the different types of failures during a product´s lifetime. However, lifetime predictions during design are inaccurate. With the advent of modern sensor technology and the internet of things, new approaches that provide a much more accurate and real-time estimate of a product’s remaining lifetime are possible.
The bathtub curve hazard function can be used to describe the probability of failure of a machine over time. Its name originates from its shape: steep to the sides and flat in the centre. The curve can be separated in three regions, which corresponds to the three different stages in the lifetime of a product.
The first region is dominated by early failures. It tells us that the probability of failure is the highest at the beginning of operations and decreases as time passes. At first, this seems counter-intuitive: why would a “brand new” structure be more likely to fail? However, if we replace “brand new” to “untested”, it makes sense: critical failures introduced at the construction stage usually show up early in the structure’s lifetime. After enough time has passed and early failures have been corrected, the product enters the second region of the bathtub curve.
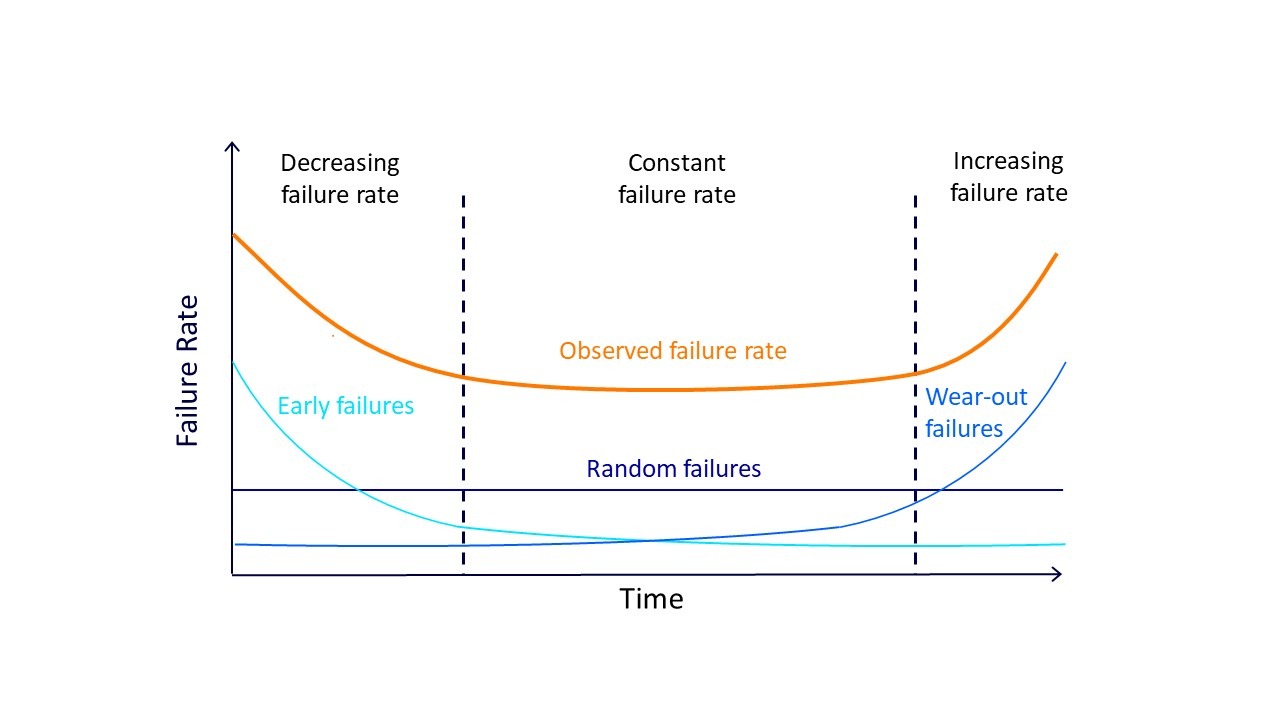
The second region corresponds to the period of normal operations. In this period, the machine works as intended and the probability of failure is dominated by random failures. Random failures are caused by a range of operational and environmental conditions: strong winds, extreme temperatures, increased load, accidental collisions, human error, etc. For a structure, most of these events cause additional dynamic forces to be present in the system. These forces usually create additional cyclic loads on the structure, increasing material fatigue. However, if these forces are not compensated adequately, structural damages may start to form.
Finally, the third region corresponds to the end-of-life period of the product, where wear-out failures are dominant. As the system gets older, material fatigue becomes considerable and the main reason for structural failure. As time passes, small fatigue cracks become larger and larger until they compromise the integrity of the whole structure. When a structure or machine reaches this stage, it is usually decommissioned due to the high risk of collapse.
An important application of the bathtub curve model is the determination of the remaining life of a structure. Currently, the lifetime of a structure is estimated at the design phase and maintenance work is performed regularly with the hope that the structure will indeed hold for the entirety of its projected lifetime. However, this estimation is rarely adjusted, only in the case of evident damage.
Is there a better way? It is known that dynamic forces cause cyclic and stochastic loads responsible for failures, particularly those due to fatigue. A constant measurement and analysis of the dynamic forces within the structure can be used to measure the real lifetime of the structure. Furthermore, this monitoring would be able to identify the points where the structure is being stressed the most, allowing operators to reinforce or repair these critical locations, reducing the overall stress and, consequently, material fatigue. This leads to a substantial increase in the lifetime of the asset and an increased level of safety.
In the past, this approach would be considered impossible due to technological or cost constraints, only conceived as a futuristic dream. However, with the advent of the internet of things and improved sensor technology, it is possible to do it today: the future has arrived.